We recently on-boarded an exciting new client to the OmniBI platform, and it became rapidly apparent that budget was being wasted through ill-conceived metrics and reporting, stifling sales opportunities.
When we onboard new clients to the OmniBI platform, there are a number of very common metrics we always tend to be asked for – and when building a client’s dashboard, we pretty much get these charts created ‘straight out of the box’. But, as part of the onboarding process, we hold a Discovery meeting, where we truly explore the activities, channels and challenges being faced by the business, prior to investigating and creating a dashboard which cuts through the clutter and unearths the metrics which matter. The value of this process became clearly apparent when we on-boarded one of our most recent new users.
“But we got loads of traffic from that campaign, it must have been successful...”
The Wonderful Agency Team, our experts behind the scenes of OmniBI, have written an excellent article explaining the metrics businesses should really consider to measure success, and the importance of not falling into the trap of focussing on vanity metrics. An obvious digital metric most users track is Traffic. A seemingly valid assumption in this scenario is that the more people you get to your website, the better.
Of course, by and large and in a lot of cases this can be a consideration, but here-in lies an origin of the old adage: Quality over Quantity. The truth is, it should really be the quality of a site’s traffic which is measured (digging into a range of other metrics to discern good, bad and ugly).
So, onto the recent example. The first thing that raised suspicions was traffic charts presenting some clear and distinct increases in traffic during certain months. Often, this can be caused by seasonal trends, or real curveballs like Covid19 (which really affected trends for some users), but more often than not, spikes in traffic are caused by an activity/action specifically geared toward this result.
After cross-referencing this against the page-views and source/medium/channel charts on this client’s dashboard, it became very apparent where these traffic increases had come from.
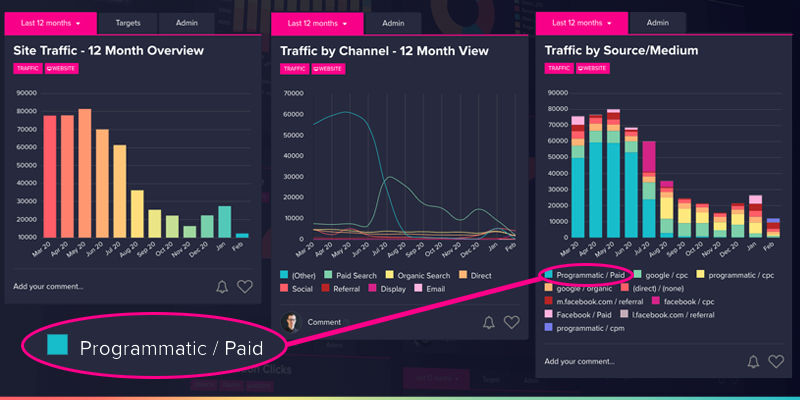
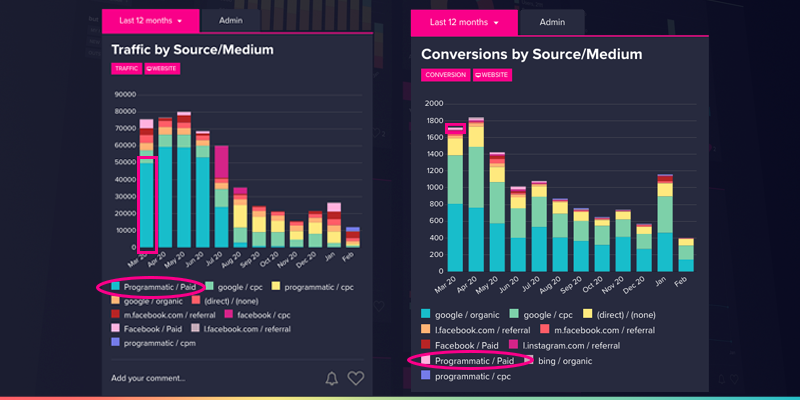
Ok, so it’s pretty obvious (and you don’t need to be a data scientist) to see that Programmatic/Paid advertising contributed to the spike between March and June 2020. So, it’s time for the team to celebrate, right? Well, before getting the champagne and considering the campaign a success, it is important to look at the metrics that matter to this business. Now, if this was a new brand, in a new market or territory, just looking to get eyeballs on the product and with the sole aim of driving traffic, one could consider this a successful campaign (depending on the budget/CPMs/CTRs etc, but we won’t get into that now).
However, this brand currently holds the second biggest share of market in their niche (only a small % away from claiming top spot), and whilst the traffic volumes from this source contributed to around 50-75% of their traffic in this period and tens of thousands of sessions, this was not reflected in the metric that mattered: purchases.
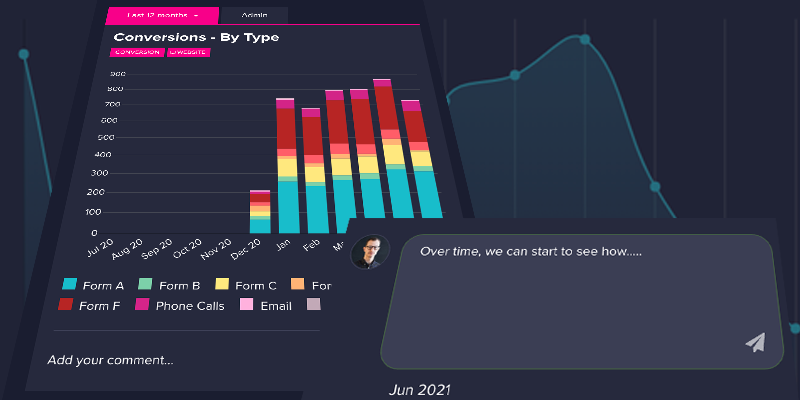
Whilst the business saw some improved conversion during these periods, the contribution to conversion directly attributable to the programmatic campaigns was not proportional. Further investigation into the sources of conversion using the Conversions vs Source/Medium chart demonstrated this clearly.
The campaign certainly drove huge increases in vanity metrics (such as impressions) and clicks/traffic to the site, but the conversion rate was being dragged down as the quality of the traffic was just not good enough. It just wasn’t the right fit for them if conversion rate was their KPI metric, or the progress would need to be monitored over a much longer term to see the actual effect (heightened brand awareness, trust/authority built, increase in buying intent over time, returning usage, conversion rate improvements in the long term, and so forth).
Data is only as valuable as the insight that can be drawn from it…
In isolation, this data may not prove very valuable. In fact, if the business had just gone on ‘traffic’ as a metric, they may have concluded that their programmatic campaign was working very well, and invested even more heavily into this as a channel. However, after aligning the performance charts to their actual goals, it becomes very apparent that there may be better ways of spending this budget on other, higher-converting channels such as their Organic activity and Google CPC campaigns where the conversion rate (a ratio of traffic/sessions to conversion actions) was substantially better.
Delivering better ROI requires both the inputs and outputs to be improved, cost and results. This is where data-driven strategic thinking can be so powerful, showing a business where they can make cost savings whilst also improving their conversion rate: lower costs, better results.
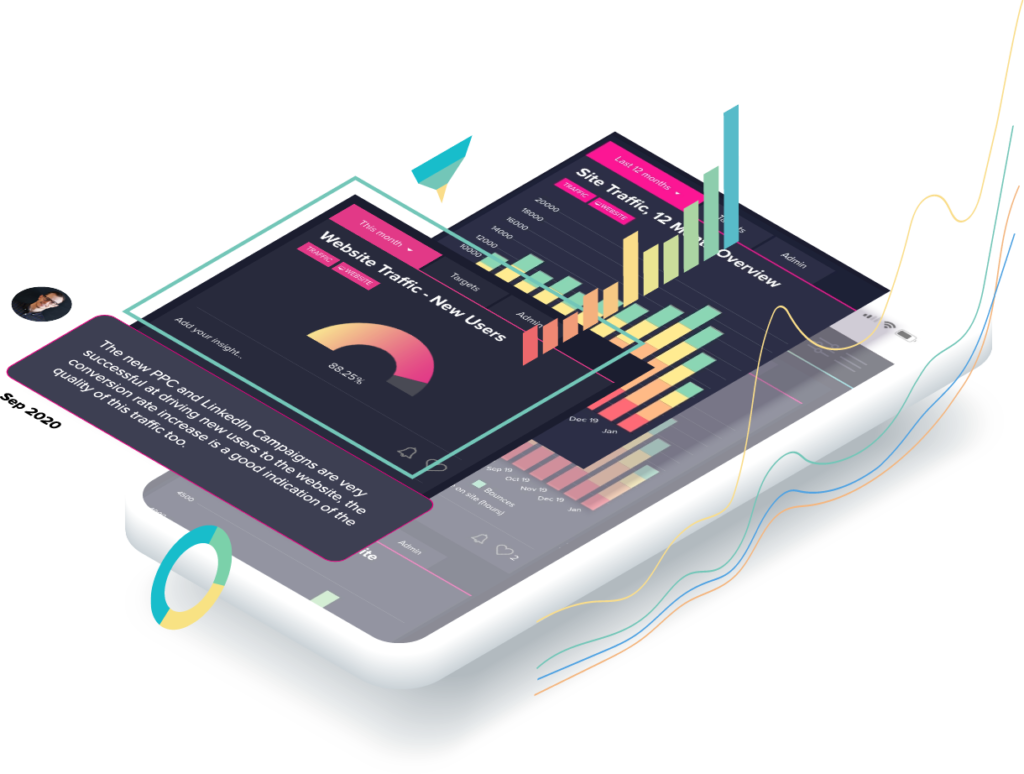
Unlike many data tools, OmniBI is powered by two-way communication with the pro-active digital experts at Wonderful. So trends like we’ve seen in this example undergo scrutiny, the team investigate the causes and effects and, more importantly, offer strategic recommendations with actions which can be taken to change the course of a negative trend (or maximise the impact of a positive one). Notifications to all user’s dashboards are received as part of an emailed daily digest, so when comments are added to charts and insight delivered in response, you’ll know right away and can implement the changes needed to bring results.
OmniBI makes this so simple, there’s not much more to say in this article. Add comments, receive actionable insights. Make better decisions, and deliver better marketing performance driven by data.
Experience it for yourself:
If you’ve already got OmniBI access, you already have this functionality and can use it right away! If not, but it’s something you and your team may find valuable, the team behind OmniBI would love to show you a demonstration of the tool, so please book a demo today.