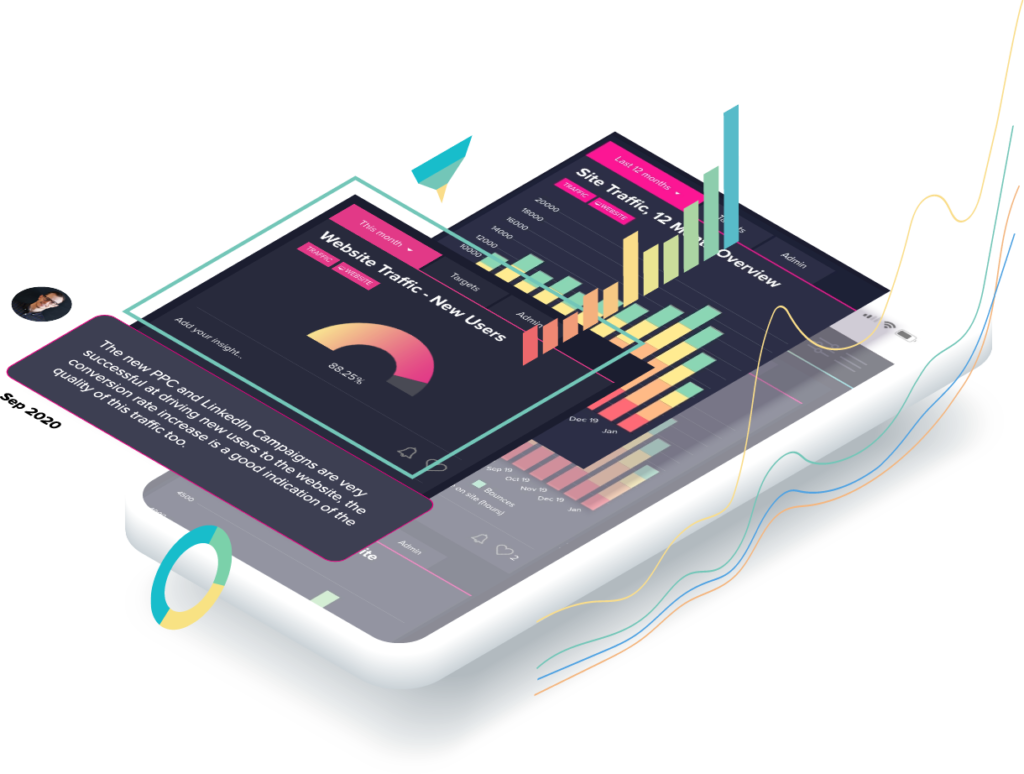
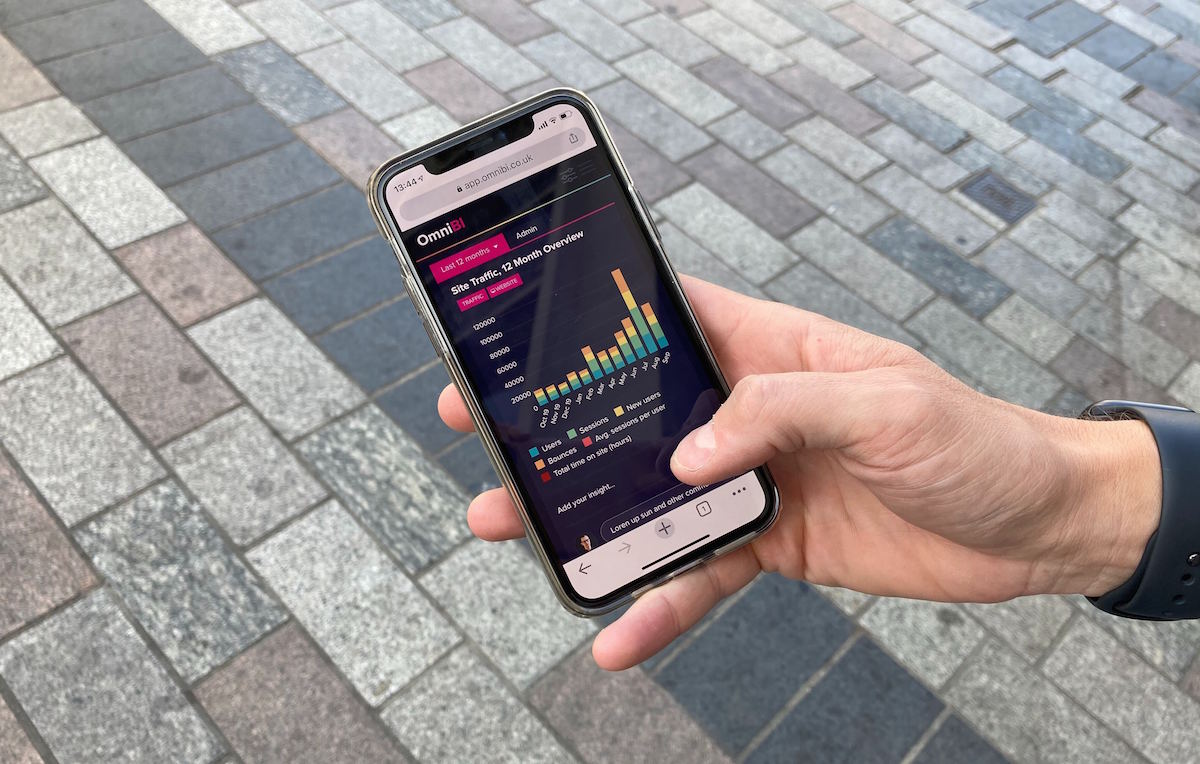
OmniBI is an incredibly powerful data and insight tool. Let’s show you some of the features.

In this video, James Gray, Head of Digital at Wonderful takes you through a whistle-stop tour of OmniBI and it’s features. Here’s what he had to say:
OmniBI takes complex data and makes it Wonderfully Simple.
“Data is everywhere. It’s incredibly powerful and incredibly valuable. But it can also be complex, confusing and nobody really knows what to do with it. Logging in to Google Analytics, Google Ads, Facebook Ads, Twitter, your CRM platform, your Phone Call Tracking system, LinkedIn, MailChimp… this all takes time, and requires you to do a lot of heavy-lifting when it comes to joining the digital dots.
OmniBI changes the game by taking all that complex data and building a simple picture that you and your team can use to inform strategy and measure performance. I’ll run you through some of the key features.
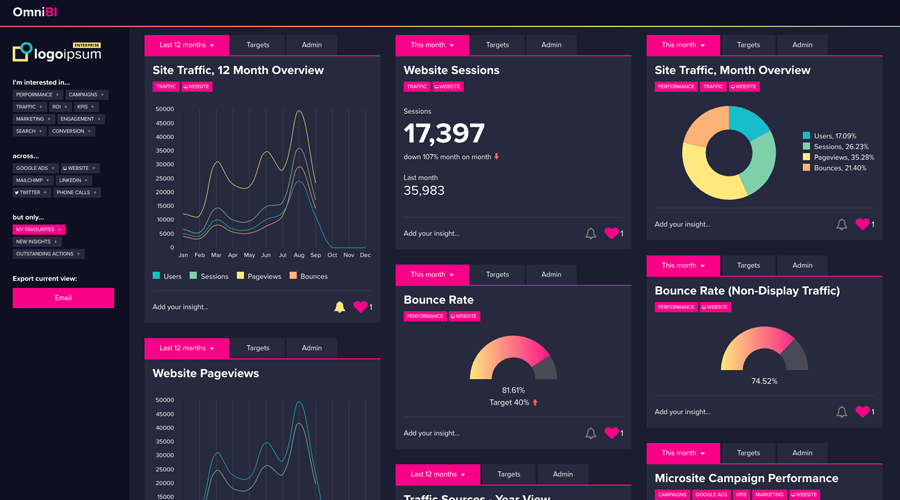
Firstly, it collates and presents all of your data in one place.
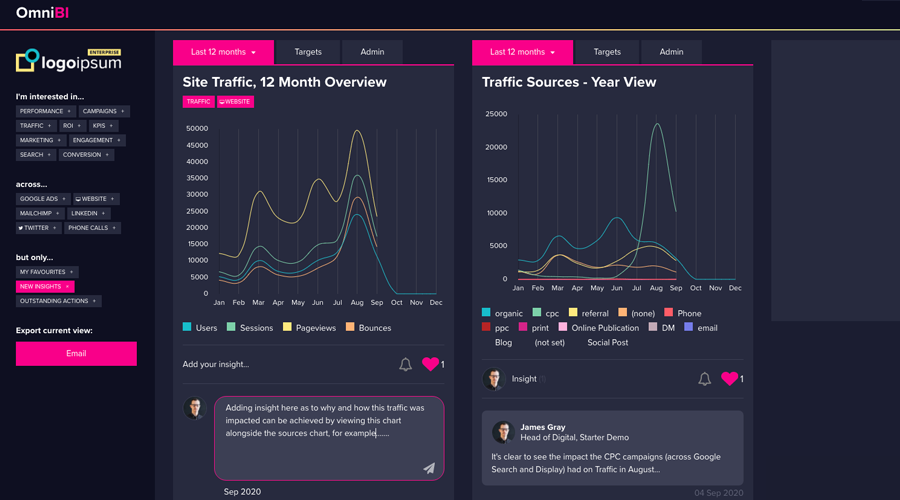
We developed OmniBI, to beautifully aggregate, analyse and present data in a meaningful and valuable way – all in one simple dashboard. Here you can see data from Google Analytics, Google Ads, MailChimp, CRM & Automation systems, Facebook, Twitter, LinkedIn and more.
Track, measure, add insight:
Next, Omni BI enables you to track and measure against your KPIs and Targets. Our tool allows you to set targets and flag KPIs to ensure you’re on-track to deliver against your business objectives.
Real added value comes from the ability to get Insights and Recommendations alongside your live data: OmniBI is powered by a team of marketing experts. Their insight enables continual innovation and optimisation of your brand’s digital performance.
Users are notified when insights and comments are left on charts to ensure the team can optimise performance across all channels.
And finally, Omni BI makes data simple to use, for everyone:
From Marketing Executives to CMOs, cutting through the noise and consolidating the data which matters to you is made simple with OmniBI. By filtering and favouriting charts, you can very easily see everything you need to see, and nothing more.
Want to see how your email campaigns are performing and whether they’re being engaged with? OmniBI can show you that.
Want to see how that microsite campaign performed in May this year? OmniBI can show you that.
Want to see the impact your campaigns are having on phone calls into the sales and support teams? OmniBI can show you that.
More, now than ever, digital marketing effectiveness comes under scrutiny, with the necessity to drive ROI requiring the aggregation of complex cross-platform metrics.
Real-time insight allows digital activities to be adapted, optimised and focussed where they will deliver the most impact, stopping your business from wasting budget where it’s not working, maximising performance.
Hopefully in this demo, I’ve shown that OmniBI not only makes reporting easier, but it enables marketers to demonstrate ROI and facilitates data-driven decision making.”
So, why not book a personalised demo and take your data to the next level, with OmniBI?
The team behind OmniBI would love to show you a more tailored demonstration of the tool, so please get in touch and book a demo today.

