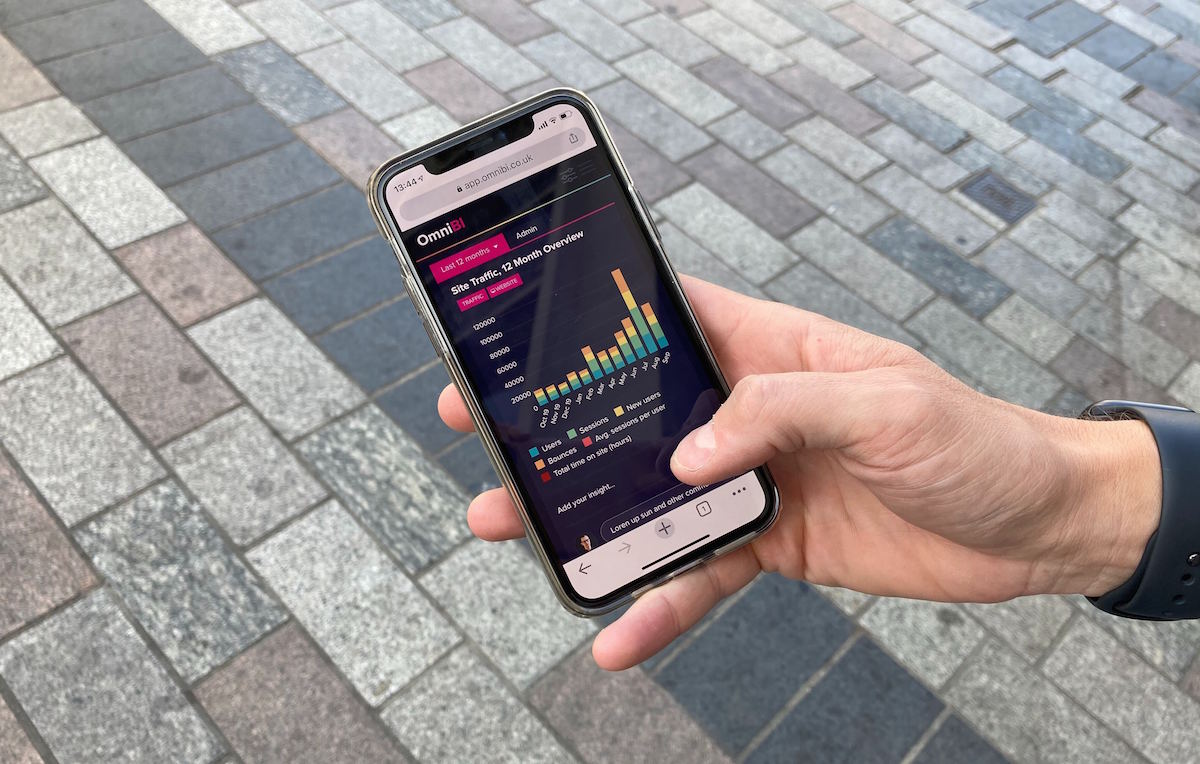
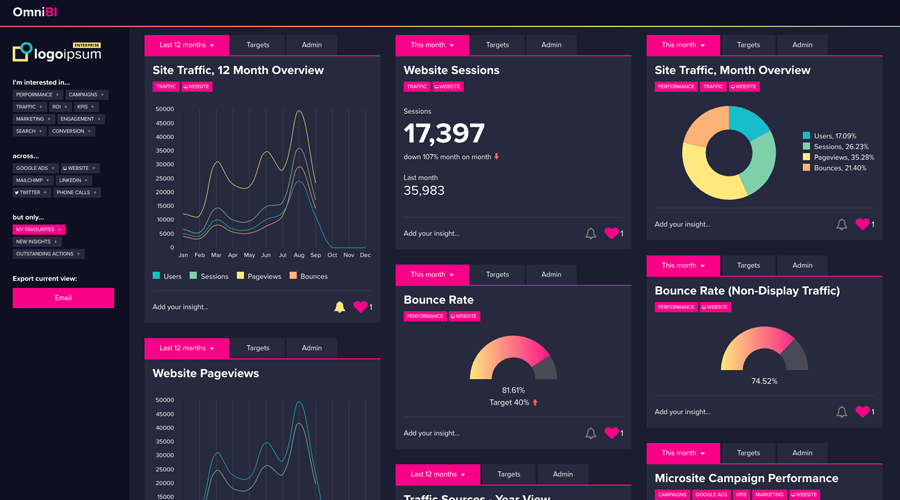
OmniBI is more than just a powerful tool for aggregating mutli-channel digital data. It is powered by a team of digital experts and promotes 2-way dialogue to explore & uncover optimisations across all digital touchpoints.
In this video, James Gray, Head of Digital at Wonderful explains just how easy it is to use OmniBI to add value to your data through actionable insights:

OmniBI enables you to ask questions and get answers.
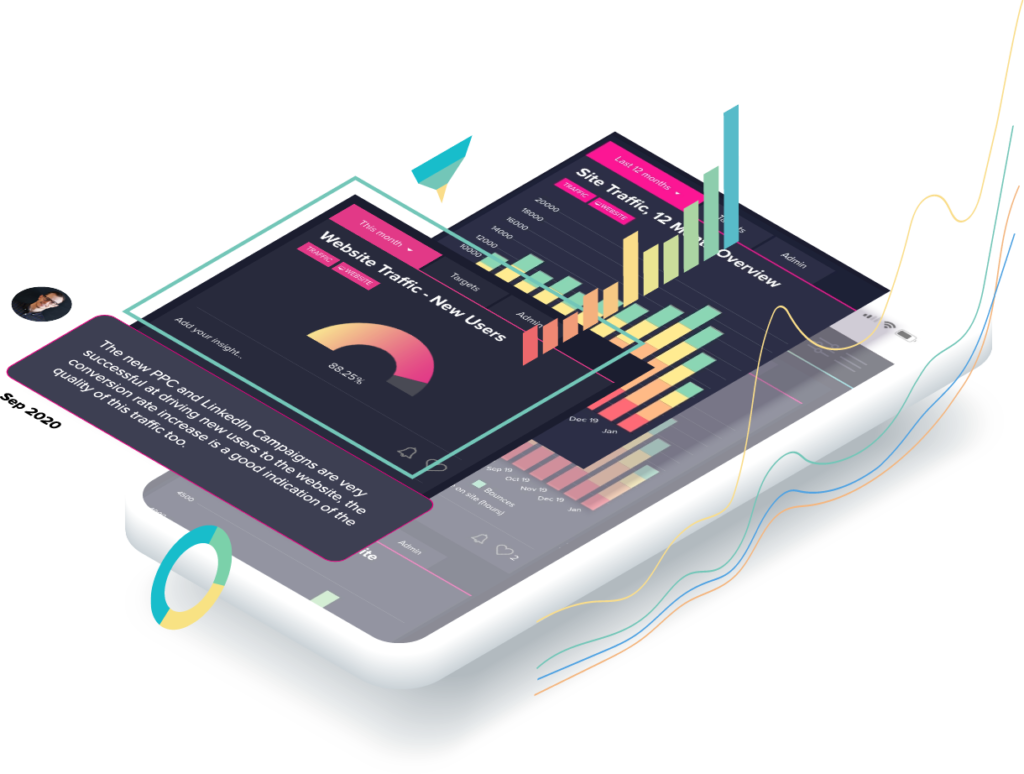
Your data tells a story, and OmniBI facilitates actionable change through it’s unique insight and commenting functionality. Picture the scene, you’re looking into the performance of your website, and you notice a sharp spike in one of your metrics – let’s say, Page Load Time.
Page Load Time is one of Google’s many ranking factors, and can impact where you sit in the SERPs (search rankings) for your target keywords, having a site-wide & keyword-agnostic negative effect should it not be rectified. For those of you on Premium or Enterprise level subscriptions, you’ll likely have had this flagged by our team before you even notice it (neat, huh?). But, should you notice something like this, you can simply ask the team powering OmniBI to investigate it for you, using the ‘Add your insight…’ functionality at the bottom of each chart.
It’s good to talk…
Unlike many data tools, OmniBI is powered by two-way communication with the digital experts at Wonderful. So, when you make this comment on a chart, the team are notified and will look to find out why a certain trend is happening and, more importantly, respond with actions which can be taken to change the course of a negative trend, or maximise the impact if positive.
Notifications to all your user’s dashboards are received as part of your emailed daily digest, so when comments are added to charts and insight delivered in response, you’ll know right away and can implement the changes needed to bring results.
It’s so simple, there’s not much more to say in this guide. Add comments, receive actionable insights. Make better decisions, and deliver better marketing performance driven by data.
Experience it for yourself:
If you’ve already got OmniBI access, you already have this functionality and can use it right away! If not, but it’s something you and your team may find valuable, the team behind OmniBI would love to show you a demonstration of the tool, so please book a demo today.


