How-To Guide – Adding Comments & Insights on Charts

Unsure how OmniBI can help your brand through a data-driven digital strategy?

Whether you know exactly what your business needs to grow, or you’re looking for independent advice and guidance to formulate a comprehensive data-driven digital strategy, let us walk you through OmniBI’s capabilities!

OmniBI makes data simple
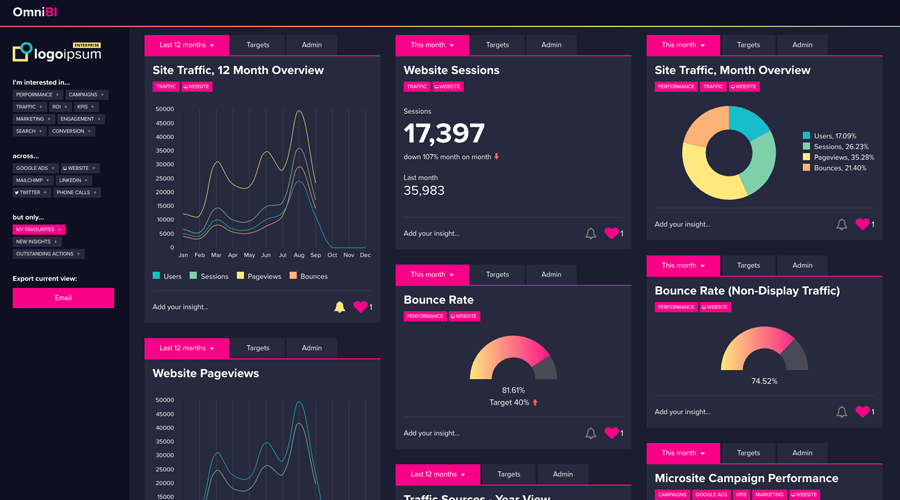
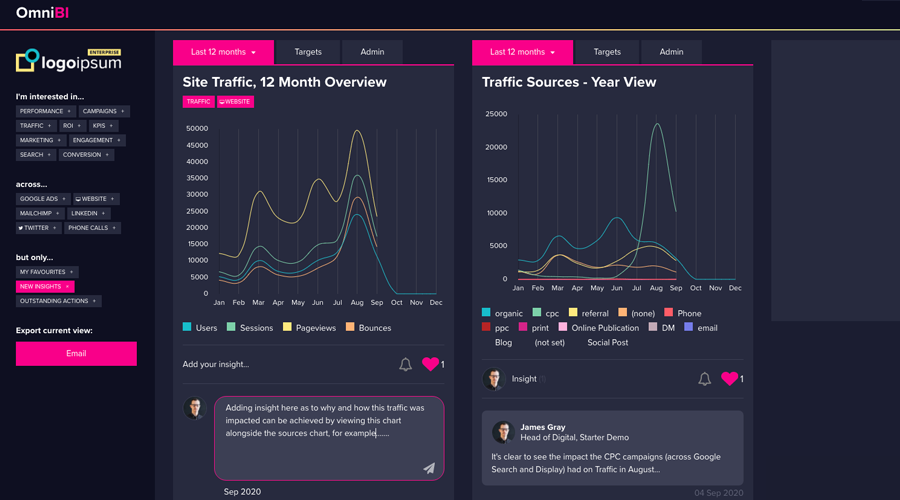
OmniBI is more than just a powerful tool for aggregating mutli-channel digital data. It is powered by a team of digital experts and promotes 2-way dialogue to explore & uncover optimisations across all digital touchpoints.

In this video, James Gray, Head of Digital at Wonderful explains just how easy it is to use OmniBI to add value to your data through actionable insights:

OmniBI enables you to ask questions and get answers. 

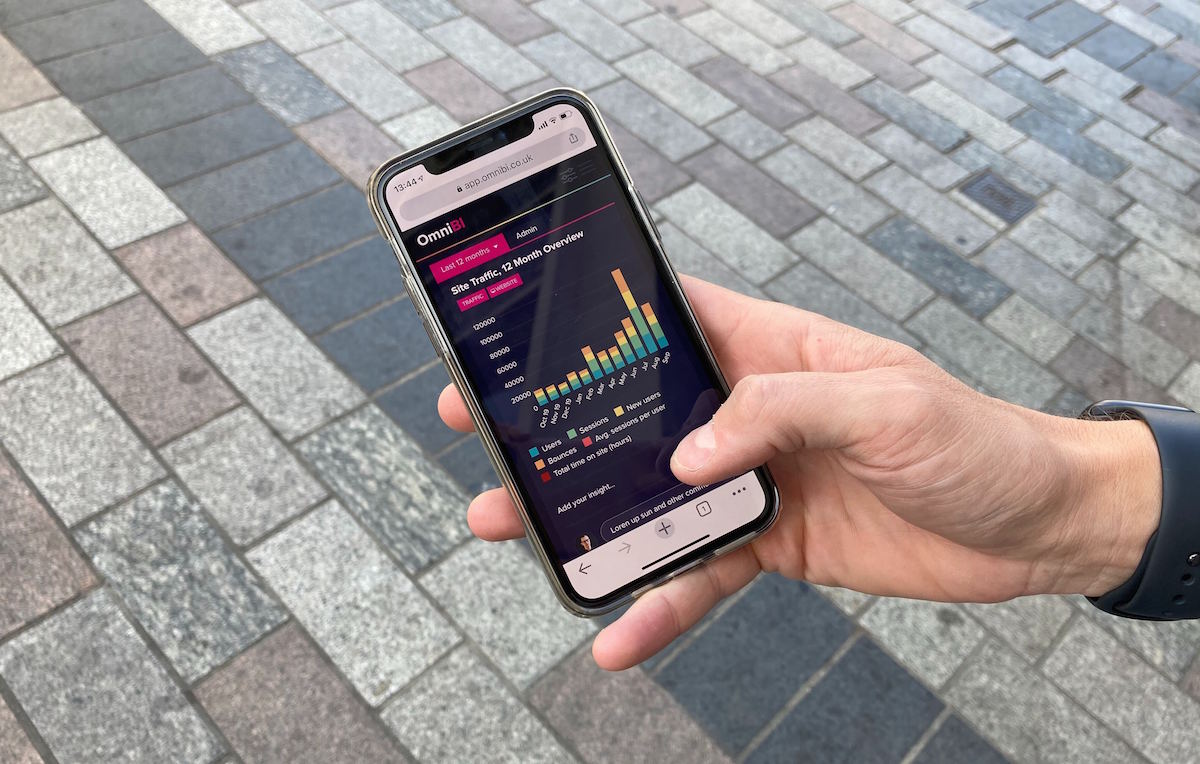
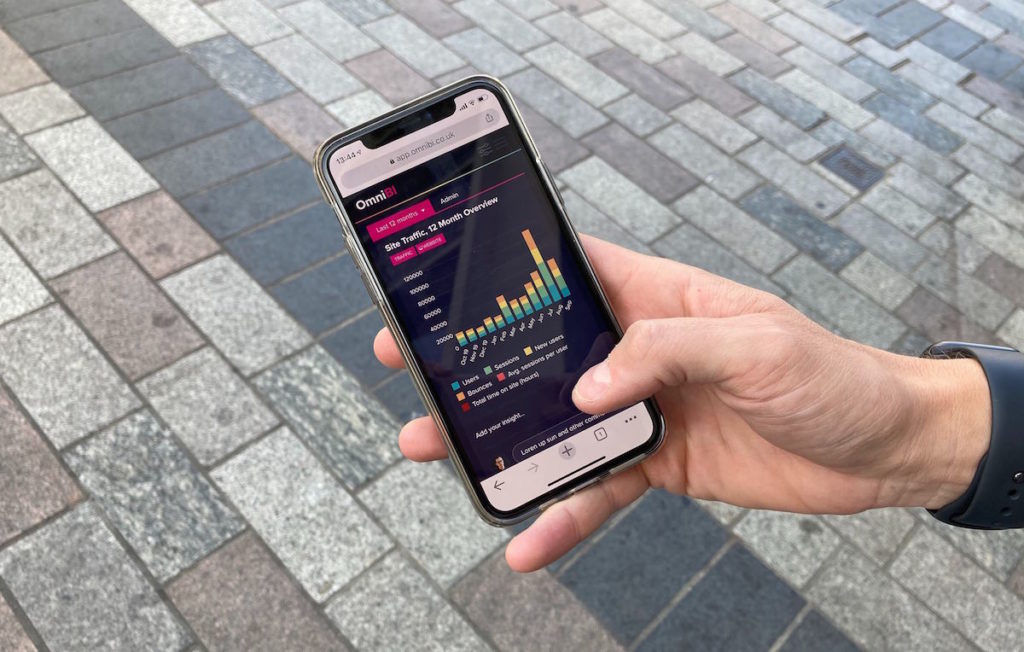
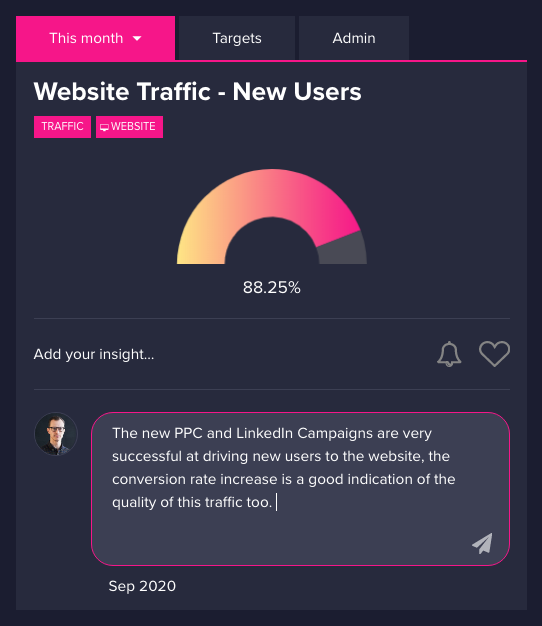
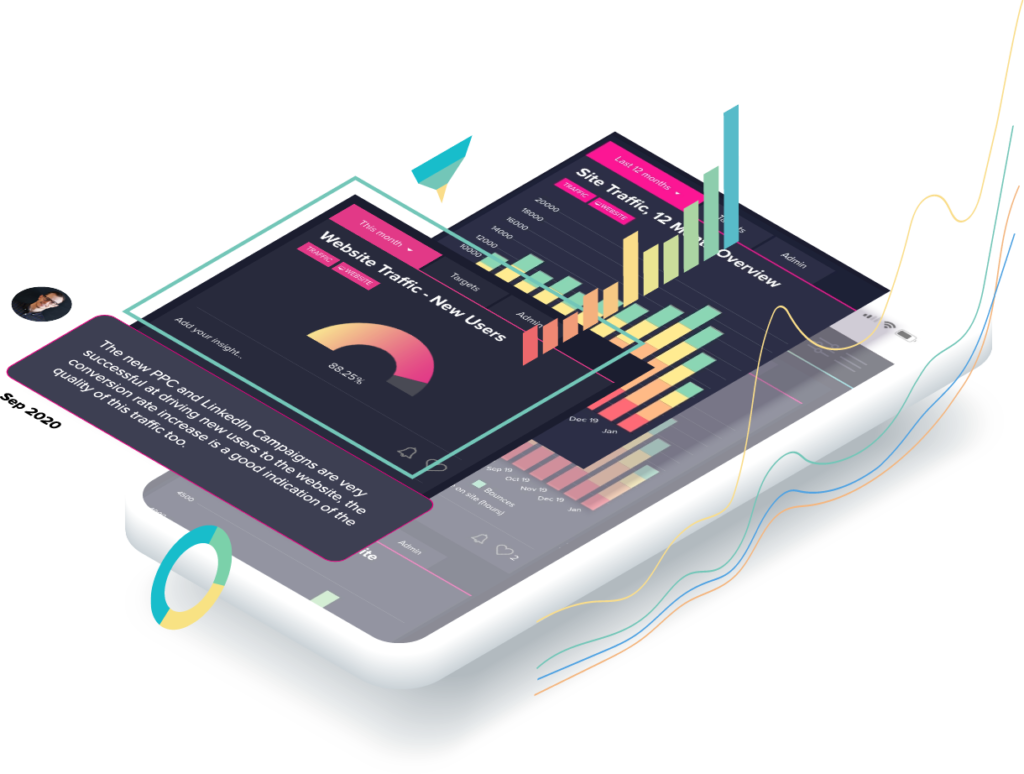
Your data tells a story, and OmniBI facilitates actionable change through it’s unique insight and commenting functionality. Picture the scene, you’re looking into the performance of your website, and you notice a sharp spike in one of your metrics – let’s say, Page Load Time.

Page Load Time is one of Google’s many ranking factors, and can impact where you sit in the SERPs (search rankings) for your target keywords, having a site-wide & keyword-agnostic negative effect should it not be rectified. For those of you on Premium or Enterprise level subscriptions, you’ll likely have had this flagged by our team before you even notice it (neat, huh?). But, should you notice something like this, you can simply ask the team powering OmniBI to investigate it for you, using the ‘Add your insight…’ functionality at the bottom of each chart.

It’s good to talk…

Unlike many data tools, OmniBI is powered by two-way communication with the digital experts at Wonderful. So, when you make this comment on a chart, the team are notified and will look to find out why a certain trend is happening and, more importantly, respond with actions which can be taken to change the course of a negative trend, or maximise the impact if positive.

Notifications to all your user’s dashboards are received as part of your emailed daily digest, so when comments are added to charts and insight delivered in response, you’ll know right away and can implement the changes needed to bring results.

It’s so simple, there’s not much more to say in this guide. Add comments, receive actionable insights. Make better decisions, and deliver better marketing performance driven by data.

Experience it for yourself: 

If you’ve already got OmniBI access, you already have this functionality and can use it right away! If not, but it’s something you and your team may find valuable, the team behind OmniBI would love to show you a demonstration of the tool, so please book a demo today.

How-To Guide – Using OmniBI on your mobile device

Unsure how OmniBI can help your brand through a data-driven digital strategy?

Whether you know exactly what your business needs to grow, or you’re looking for independent advice and guidance to formulate a comprehensive data-driven digital strategy, let us walk you through OmniBI’s capabilities!

OmniBI makes data simple
OmniBI renders beautifully on any device. We know that you’ll want to check performance on-the-go, so here’s how.

In this post, James Gray, Head of Digital at Wonderful explains just how easy it is to use OmniBI on mobile devices:

OmniBI enables you to check your performance on the move. 

Your dashboards look great on desktop devices, but they look just as beautiful when you’re away from the office, which is particularly useful during these times of remote working.

Have you tried logging in to Google Analytics, Google Ads, the insights tab of your Social channels, and your CRM on-the-go? It’s time consuming, clunky and a terrible user experience. Here’s where OmniBI gives you yet another wonderfully simple (and enjoyable) experience, with a simple login interface, and full screen charts for clarity.

OmniBI looks great on Mobile Phone

Form & Function:

Unlike many mobile experiences, there’s no loss of functionality. Tap on charts to see the numbers behind the visualisations and tap on the key/legend to turn on/off metrics within charts to focus down, as you would on the desktop version. Those all important filters and channel tags are all easily accessible within one tidy navigation (top) allowing you to focus on the charts you want to see. Plus, the data-range filter at the top of each chart works seamlessly too.

Favourites and Insight functionality also live in the mobile environment, meaning you can start dialogue about your charts, ask questions and get insight and recommendations from our expert team wherever you want, whenever you want.

Experience it for yourself: 

If you’ve already got OmniBI access in the office, you’ve got access in your pocket too. On mobile, tablet, in fact anywhere with internet access, the tool is ready for you. The team behind OmniBI would love to show you a demonstration of the tool, so please book a demo today.

How-To Guide – OmniBI Feature Overview

Unsure how OmniBI can help your brand through a data-driven digital strategy?

Whether you know exactly what your business needs to grow, or you’re looking for independent advice and guidance to formulate a comprehensive data-driven digital strategy, let us walk you through OmniBI’s capabilities!

OmniBI makes data simple
OmniBI is an incredibly powerful data and insight tool. Let’s show you some of the features.

In this video, James Gray, Head of Digital at Wonderful takes you through a whistle-stop tour of OmniBI and it’s features. Here’s what he had to say:

OmniBI takes complex data and makes it Wonderfully Simple

“Data is everywhere. It’s incredibly powerful and incredibly valuable. But it can also be complex, confusing and nobody really knows what to do with it. Logging in to Google Analytics, Google Ads, Facebook Ads, Twitter, your CRM platform, your Phone Call Tracking system, LinkedIn, MailChimp… this all takes time, and requires you to do a lot of heavy-lifting when it comes to joining the digital dots.

OmniBI changes the game by taking all that complex data and building a simple picture that you and your team can use to inform strategy and measure performance. I’ll run you through some of the key features. 

Firstly, it collates and presents all of your data in one place.

We developed OmniBI, to beautifully aggregate, analyse and present data in a meaningful and valuable way – all in one simple dashboard. Here you can see data from Google Analytics, Google Ads, MailChimp, CRM & Automation systems, Facebook, Twitter, LinkedIn and more. 

Track, measure, add insight:

Next, Omni BI enables you to track and measure against your KPIs and Targets. Our tool allows you to set targets and flag KPIs to ensure you’re on-track to deliver against your business objectives. 

Real added value comes from the ability to get Insights and Recommendations alongside your live data: OmniBI is powered by a team of marketing experts. Their insight enables continual innovation and optimisation of your brand’s digital performance. 

Users are notified when insights and comments are left on charts to ensure the team can optimise performance across all channels. 

And finally, Omni BI makes data simple to use, for everyone: 

From Marketing Executives to CMOs, cutting through the noise and consolidating the data which matters to you is made simple with OmniBI. By filtering and favouriting charts, you can very easily see everything you need to see, and nothing more. 

Want to see how your email campaigns are performing and whether they’re being engaged with? OmniBI can show you that. 

Want to see how that microsite campaign performed in May this year? OmniBI can show you that.  

Want to see the impact your campaigns are having on phone calls into the sales and support teams? OmniBI can show you that.  

More, now than ever, digital marketing effectiveness comes under scrutiny, with the necessity to drive ROI requiring the aggregation of complex cross-platform metrics. 

Real-time insight allows digital activities to be adapted, optimised and focussed where they will deliver the most impact, stopping your business from wasting budget where it’s not working, maximising performance. 

Hopefully in this demo, I’ve shown that OmniBI not only makes reporting easier, but it enables marketers to demonstrate ROI and facilitates data-driven decision making.”

So, why not book a personalised demo and take your data to the next level, with OmniBI? 

The team behind OmniBI would love to show you a more tailored demonstration of the tool, so please get in touch and book a demo today.

OmniBI Feature Update – September 2020

Unsure how OmniBI can help your brand through a data-driven digital strategy?

Whether you know exactly what your business needs to grow, or you’re looking for independent advice and guidance to formulate a comprehensive data-driven digital strategy, let us walk you through OmniBI’s capabilities!

OmniBI makes data simple
OmniBI just got a whole lot more powerful, thanks to the latest version update release. Let’s show you some of the exciting new features:

In this video, James Gray, Head of Digital at Wonderful takes our community of users through the latest version update of OmniBI including some exciting new features:

OmniBI September Update:

The new features coming to your OmniBI Dashboards from September 2020 include:

  • Split by multiple metrics – the ability to split charts by cross-referencing multiple metrics beyond time/date means your dashboard can show your digital data in even more granularity.
  • Drill down by Week & Day – users love our 12 Month and Monthly views for the beautiful chart visualisations, but we know that some users want to track channel performance to the day, so we introduced charts which can drill down by Week and Day views.
  • New chart type: Table view – whilst our bar, line, pie and gauge charts (to name but a few) are all very beautiful, sometimes a plain-old table does the job. So we’ve added this feature.
  • Report export – whilst OmniBI gives you ‘real-time’ visibility of your multi-channel digital data, sometimes an old-school monthly or weekly report is needed. Users can now set a view using the existing filter functionality, and click the ‘Email PDF’ button to have a PDF generated and emailed to the user’s address. Great for internal reporting, printing and discussing with the team (please think of the trees) and/or cutting and pasting into presentation decks.
  • Email notifications – now, when the Wonderful team add their valued insight and recommendations on your charts, or create new ones on your behalf, a daily email digest lands in your inbox to let you know. Cool, huh?

We hope you like these feature updates – they are currently all available to ALL user levels (Starter, Premium and Enterprise), but will soon be limited to their relevant tier. If you’d like to discuss access to these features, do not hesitate to drop us an email.

Not using OmniBI yet? 

The team behind OmniBI would love to show you a more tailored demonstration of the tool including all of these new features (and a whole OmniBI Overview), so please get in touch and book a demo today.