In marketing, data largely dominates the resources available to understand consumer preferences. However, this data, often quantitative, doesn’t prescribe a clear course of action for marketers without the essential execution of data analysis and, possibly, some data configuration.
‘Storytelling’ describes the ideal process through which marketers are able to understand data relating to consumer behaviour, and consequently, inform changes to various services and their digital marketing strategy. More explicitly, good storytelling requires data to be configured or structured in a way where all the relevant data is accessible in one space and able to be formatted in the most comprehensible way. This is a necessary step before performing data analysis.
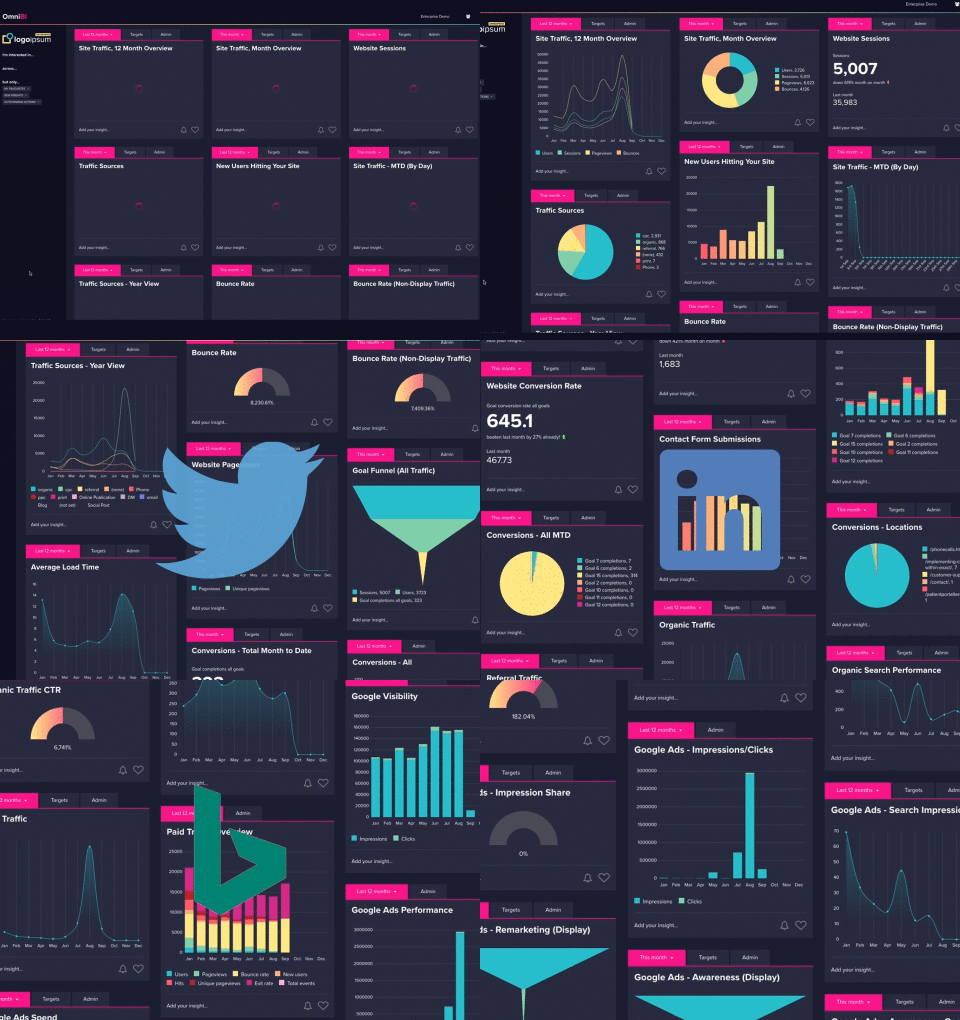
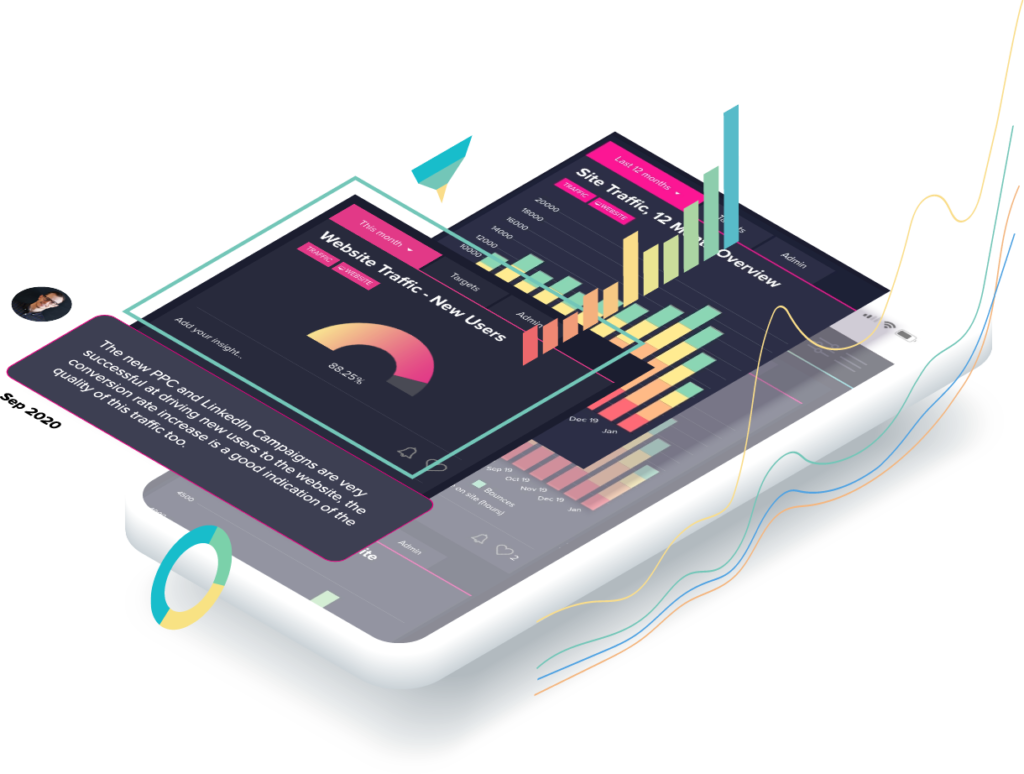
This is where a data and insight tool like OmniBI comes in. Let’s say you need to analyse and evaluate the performance of paid campaigns across LinkedIn, Facebook, and Instagram. OmniBI is able to seamlessly integrate financial, engagement and behaviour-related results from your various social media advertising platforms, but also CRMs, e-commerce providers etc., into one platform. Also, all data, regardless of its source, can be displayed in flexible, representational formats, including graphs and charts, that render comparative analysis much easier than the siloed, analytical process of separate platforms.

“ Adjusting your services and digital marketing strategy in line with the data insights is the most difficult part.”
Once the data is well-assembled and formatted, we can focus on data analysis. Firstly, there isn’t one way of acquiring accurate consumer insights from data. In truth, adjusting your services and digital marketing strategy in line with the data insights is the most difficult part. This is because data analysis’s importance resides in the role it plays in broader decision-making. To illustrate the ease that a storytelling approach brings to data analysis, this part can be more clearly explained with a step-by-step guide highlighting three key practices for getting answers from data:
1. Ensure your data is specific and measures for your business goals
In simple terms, ensure the data you are collecting is relevant for the business goal you aim to achieve (like these clients). Ideally, a quick data reading should suggest a positive or negative trend for a specific business goal. But for non-financial goals, this can be more challenging. Therefore, it is crucial to understand how business goals, such as customer experience or brand engagement, can be measured for consumers interacting with your digital channels. For example, brand engagement may be measured by the number of people who visit a new page on your website. Google provides a useful guide in setting specific actions on a webpage as measurable data points on Google Ads.
2. Analyse metrics over time
This is appropriate if you have ever wondered whether a change in performance is temporary or if there is a more impactful negative trend in one of your key performance indicators. Furthermore, consumer behaviour varies over time, but there are seasonal trends. Comparing metrics over time can also mean factoring in seasonal trends or the real-world context into interpreting consumer data results. Lastly, it is key to note that this frame of thought should be applied throughout the data analysis process.
3. Analyse metrics in relation to one another and while using dimensions
Data doesn’t say much when read in isolation. A company’s yearly revenue of a billion dollars doesn’t give any insight into that same company’s financial health, just like several thousand daily website hits doesn’t say anything about the users’ experience of the website content. In comparing multiple related metrics, you are able to build a more robust understanding of your consumer’s experience and areas where you succeed and fail.
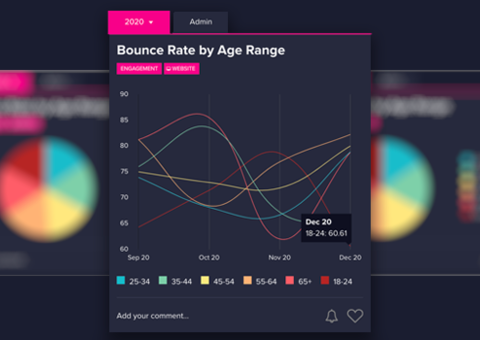
Dimensions are attributes that characterise your data and which can be used to further segment data results. In digital marketing, examples of dimensions include location, pages accessed, device-type etc. Filtering and cross-referencing data according to dimensions allows for even more refined comparative analysis, and thus provides more consumer insight to marketers allowing for positive and productive changes to services and strategy for all parties.
There’s not always a simple answer
Conclusively, not all data analysis needs to deliver a change. It is important to know that insights shouldn’t be forced, especially if the data doesn’t highlight a clear change in consumer behaviour, and it is smart to monitor the results until you are able to naturally gain a better understanding of the data.
If you need help with getting answers from your data, why not book a demo of OmniBI today?


