How to get answers from data?

Unsure how OmniBI can help your brand through a data-driven digital strategy?

Whether you know exactly what your business needs to grow, or you’re looking for independent advice and guidance to formulate a comprehensive data-driven digital strategy, let us walk you through OmniBI’s capabilities!

OmniBI makes data simple

In marketing, data largely dominates the resources available to understand consumer preferences. However, this data, often quantitative, doesn’t prescribe a clear course of action for marketers without the essential execution of data analysis and, possibly, some data configuration.

‘Storytelling’ describes the ideal process through which marketers are able to understand data relating to consumer behaviour, and consequently, inform changes to various services and their digital marketing strategy. More explicitly, good storytelling requires data to be configured or structured in a way where all the relevant data is accessible in one space and able to be formatted in the most comprehensible way. This is a necessary step before performing data analysis.

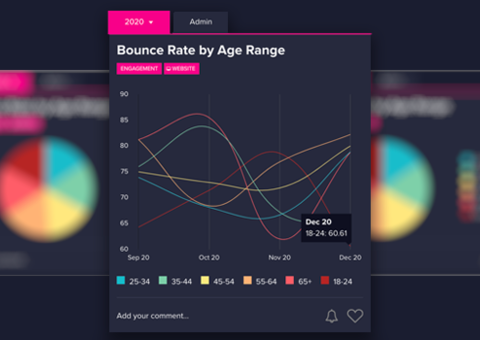
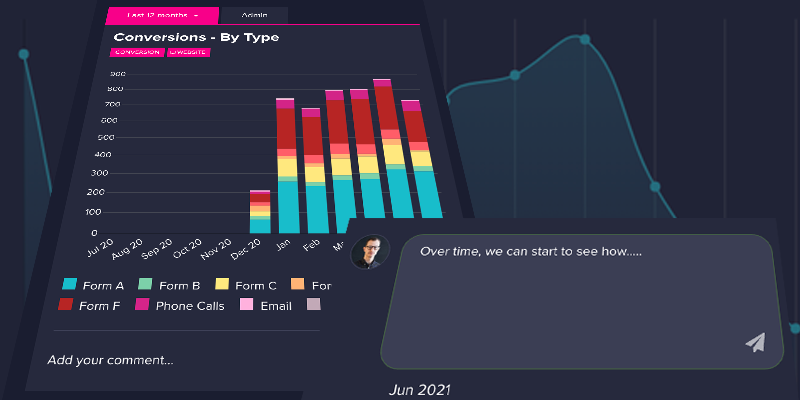
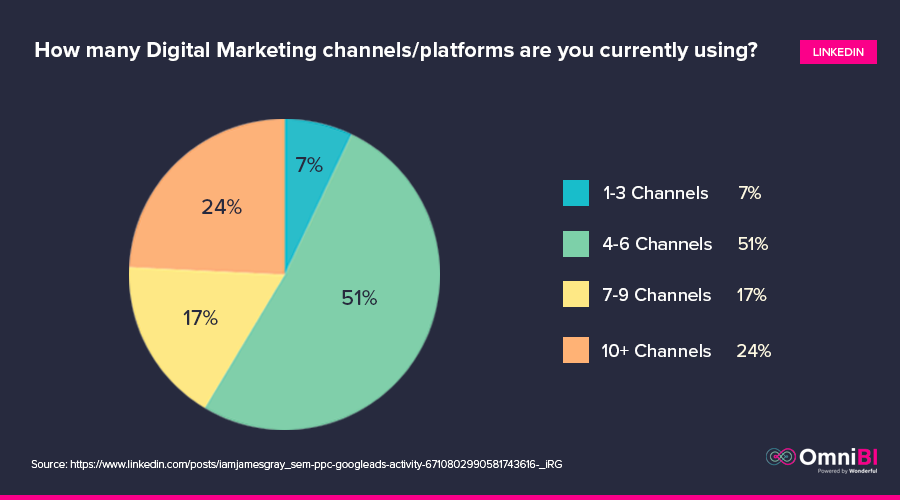
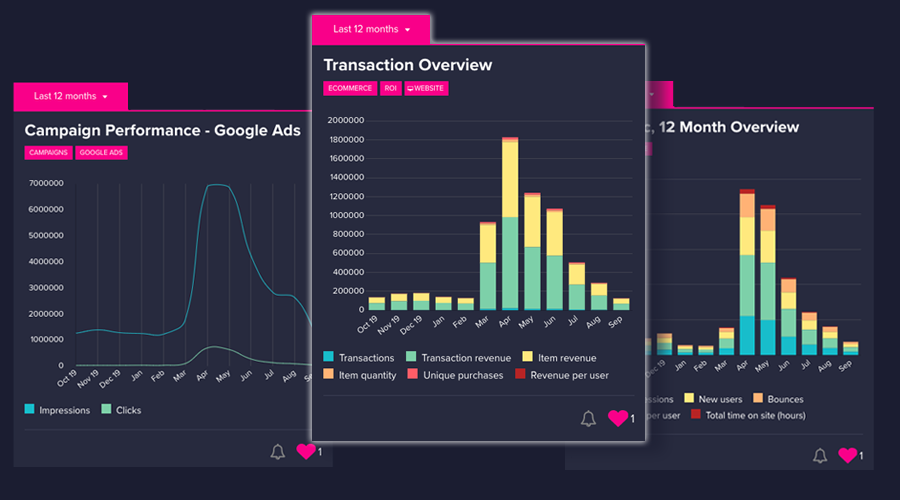
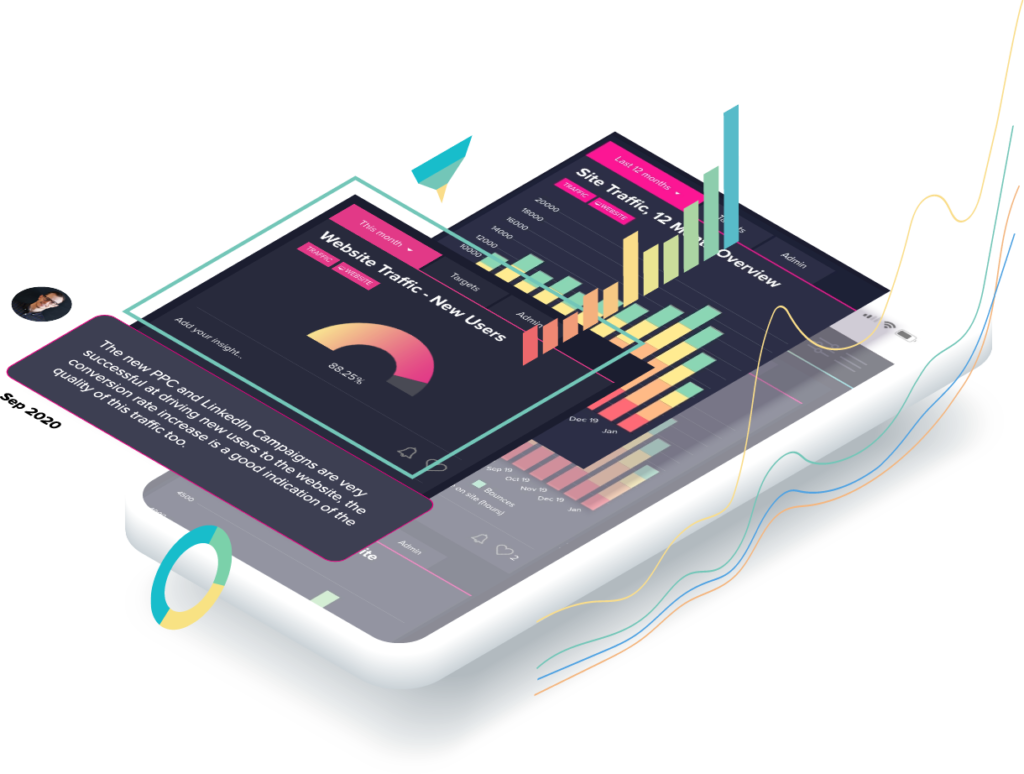
This is where a data and insight tool like OmniBI comes in. Let’s say you need to analyse and evaluate the performance of paid campaigns across LinkedIn, Facebook, and Instagram. OmniBI is able to seamlessly integrate financial, engagement and behaviour-related results from your various social media advertising platforms, but also CRMs, e-commerce providers etc., into one platform. Also, all data, regardless of its source, can be displayed in flexible, representational formats, including graphs and charts, that render comparative analysis much easier than the siloed, analytical process of separate platforms.

Presenting multi-source data in unified format

“ Adjusting your services and digital marketing strategy in line with the data insights is the most difficult part.”

Once the data is well-assembled and formatted, we can focus on data analysis. Firstly, there isn’t one way of acquiring accurate consumer insights from data. In truth, adjusting your services and digital marketing strategy in line with the data insights is the most difficult part. This is because data analysis’s importance resides in the role it plays in broader decision-making. To illustrate the ease that a storytelling approach brings to data analysis, this part can be more clearly explained with a step-by-step guide highlighting three key practices for getting answers from data:

1.      Ensure your data is specific and measures for your business goals

In simple terms, ensure the data you are collecting is relevant for the business goal you aim to achieve (like these clients). Ideally, a quick data reading should suggest a positive or negative trend for a specific business goal. But for non-financial goals, this can be more challenging. Therefore, it is crucial to understand how business goals, such as customer experience or brand engagement, can be measured for consumers interacting with your digital channels. For example, brand engagement may be measured by the number of people who visit a new page on your website. Google provides a useful guide in setting specific actions on a webpage as measurable data points on Google Ads.

2.      Analyse metrics over time

This is appropriate if you have ever wondered whether a change in performance is temporary or if there is a more impactful negative trend in one of your key performance indicators. Furthermore, consumer behaviour varies over time, but there are seasonal trends. Comparing metrics over time can also mean factoring in seasonal trends or the real-world context into interpreting consumer data results. Lastly, it is key to note that this frame of thought should be applied throughout the data analysis process.

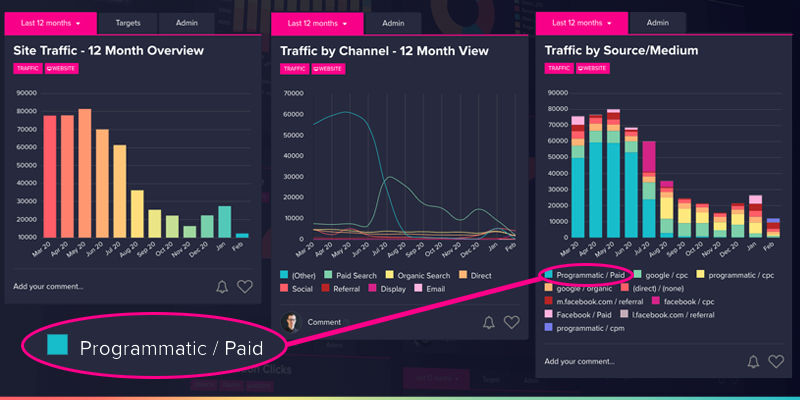
3.      Analyse metrics in relation to one another and while using dimensions

Data doesn’t say much when read in isolation. A company’s yearly revenue of a billion dollars doesn’t give any insight into that same company’s financial health, just like several thousand daily website hits doesn’t say anything about the users’ experience of the website content. In comparing multiple related metrics, you are able to build a more robust understanding of your consumer’s experience and areas where you succeed and fail.

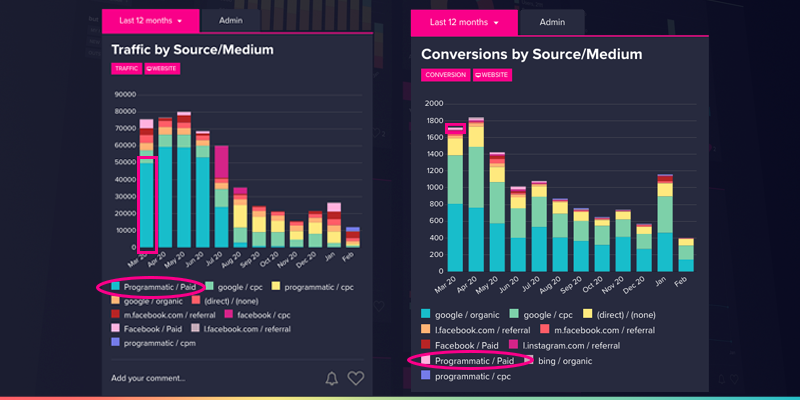
Dimensions are attributes that characterise your data and which can be used to further segment data results. In digital marketing, examples of dimensions include location, pages accessed, device-type etc. Filtering and cross-referencing data according to dimensions allows for even more refined comparative analysis, and thus provides more consumer insight to marketers allowing for positive and productive changes to services and strategy for all parties.

There’s not always a simple answer

Conclusively, not all data analysis needs to deliver a change. It is important to know that insights shouldn’t be forced, especially if the data doesn’t highlight a clear change in consumer behaviour, and it is smart to monitor the results until you are able to naturally gain a better understanding of the data.

If you need help with getting answers from your data, why not book a demo of OmniBI today?

What Does Value From Website Tracking Look Like?

Unsure how OmniBI can help your brand through a data-driven digital strategy?

Whether you know exactly what your business needs to grow, or you’re looking for independent advice and guidance to formulate a comprehensive data-driven digital strategy, let us walk you through OmniBI’s capabilities!

OmniBI makes data simple

Across media channels, it is no secret that there is a desire to access more specific consumer metrics to inform, measure, and evaluate customer engagement efforts, particularly when it comes to advertising. Even though this opinion is probably echoed most frequently in relation to TV, the increased relevance of online experiences to most individuals’ consumer journeys, along with the ‘death of the high street’, means that the desire to measure customer online behaviour has extended to many organisations with proprietary websites.

Website tracking allows for the gathering of precise data that measures how users engage with websites. As in the case of in-person interactions, website tracking ideally provides insight into consumers’ intentions, their preferences, and their demographics. This function is usually accomplished with a data analytics service like Google Analytics and can be sharpened with an accompanying customer relationship management (CRM) platform, to provide a summarised and personalised account of consumers’ website interactions respectively. But there are also additional data tools that provide unique insight into customers’ online behaviour that can meet some organisation’s needs.

Presenting multi-source data in unified format

And now, to the central concern of this article: how should the insight from website tracking be used by companies? Well, companies’ interest in measuring customer engagement is centred around measuring the gains from their engagement or advertising efforts and then seeking to improve it, but this may not be valuable for the user and is certainly different to optimising the customers’ online experience. A good example would be obstructive cookie banners that users have to accept in order to view any meaningful content on the webpage. Often, companies are enamoured with encouraging consumers to take desirable actions, however this greatly differs from improving the user experience or the consumer journey’s fluidity. To rectify this, we will now consider Customer Performance Indicators. 

Harvard Business Review describes Customer Performance Indicators (CPIs) as metrics that relate to how a company is performing for its consumers, including time, convenience, and money saved as key variables. These indicators are usually harder to evaluate as customer satisfaction is indirectly represented by the actions or metrics registered within web analytics tools, whereas organisational goals tend to be directly measured by these metrics. Regardless, CPIs should be used in collaboration with Key Performance Indicators (KPIs), which conversely measure desirable goals for the organisation, to collaboratively inform how insights are implemented on a website. A pertinent example where organisations navigate between their goals and the customer’s goals can be demonstrated with an example taken from my personal experience.

Website tracking incorporates the touchpoints from which a website can be accessed

According to Universities UK, there are 2.38 million university students in UK institutions. In any given year, these students are likely to contribute to a steady stream of website traffic to gain an understanding of prospective employers. Unfortunately, in my prior experience researching various companies, my status as a student meant that the supposedly free access to informative company reports had occasionally been disrupted by compulsory fields requiring work emails or places of work to be filled out. Here is where the value of website tracking comes in. This issue could possibly have been recognised by conducting data analysis that incorporated the age groups that accessed the page and the page’s bounce rate. At the very least, some data analysis would highlight an issue with the page, and from this point, further data or analysis, into customer touchpoints for example, could be conducted to provide clarity. Consequently, a simple, balanced solution to this problem could then be considered, such as removing the restrictive fields but still request personal information so as to cater towards the CPI of increased convenience while retaining all KPIs.

Presenting multi-source data in unified format

In a situation where Google Analytics doesn’t illuminate such issues, a customer relationship management platform can be used in tandem to provide a more detailed understanding of customers’ online behaviour. Additionally, website tracking incorporates the touchpoints from which a website can be accessed. This simply means understanding the online behaviour of users that arrive on your website from sites like Facebook, search engine ads, email newsletters etc. In this respect, organisations should value the full scope of website tracking and the potential value this provides to their range of interactions with their breadth of customers.

In OmniBI, we also provide a data tool that assists in website tracking and data analysis. It works by unifying the recorded data and results of customer’s website interactions from diverse platforms, including Google Analytics, into a single, coherent dashboard. If you wish to learn about how our service can help amplify the value obtained from your website tracking efforts for both your consumers and your organisation, you can contact us here.

An Introduction to Omnichannel Marketing

Unsure how OmniBI can help your brand through a data-driven digital strategy?

Whether you know exactly what your business needs to grow, or you’re looking for independent advice and guidance to formulate a comprehensive data-driven digital strategy, let us walk you through OmniBI’s capabilities!

OmniBI makes data simple

‘Omnichannel’ has become a ubiquitous term in marketing, eliciting ideas of a highly fluid, dynamic, customer-centric strategy. But simply, the term ‘omnichannel’ describes the integrated use of multiple, different communication channels as part of a unified function. 

In practice, omnichannel marketing is a marketing approach that jointly aims to facilitate customer engagement and customer service. Companies that adopt an omnichannel marketing approach tend to be interested in executing their marketing strategy as a constitutive part of their sales funnel i.e. creating potential customer journeys that culminate in the purchase of a good or service. Therefore, any advice regarding a company’s omnichannel marketing strategy should address the role of sales in delivering the consumer-centric experience.

Despite this, it is important that omnichannel marketing is primarily conducted as a marketing strategy. It should be entirely rooted in strategy and insight, which branches off and feeds their use of specific communication channels. Within this method, companies possess an informed understanding of how each communication channel appeals to their customers, from email to social media marketing, and can construct a system that enhances the ways customers interact with their online channels. This idea will be revisited later.

A roundabout connecting eight roads

The Value of Omnichannel Marketing for B2B Business

In many ways, the pandemic has had a devastating impact on business, yet it has also accelerated the adoption of more flexible, and in this case, consumer-centric business methods, including the omnichannel marketing approach. In particular, a lot of the support for engaging omnichannel marketing strategies has rightly been directed towards B2B companies. Mckinsey demonstrated the increasing value provided towards B2B companies in their survey – in February 2021, 58% of B2B companies said their omnichannel strategy works better than past approaches for reaching and serving existing customers, in comparison to only 27% having said so in April 2020. 

A study by Think with Google observing the emotions customers associated with their vendors and service providers showed that, for B2C brands, emotional connections were shared largely between 10% and 40% of consumers. Whereas amongst B2B brands, the majority held a connection with over 50% of their consumers. But where is the link between emotions and omnichannel marketing you may wonder.

Just to clarify, B2B customers aren’t emotional; they are simply heavily invested in making the right purchase decision. A breadth of factors are considered by B2B consumers, such as supplier reputation, alignment with brand ethos, and the investment value. According to Accenture, most B2B buyers are already 57% of the way through the buying process before their first meeting with a representative. These B2B customers undergo most of this trust-building, value-seeking, and rational process by conducting a breadth of research, composed of product and company-related information along with sentiment, from the range of communication channels available. In other words, a good omnichannel marketing strategy can work towards securing new business for B2B companies before any face-to-face interaction.

How to Apply an Omnichannel Marketing Strategy?

An omnichannel marketing strategy is frequently developed on an existing multichannel strategy. Multichannel strategies are widely established because people prefer to engage with brands and businesses through multiple channels. The first stage of executing an omnichannel marketing strategy involves classifying the customers that interact with your company’s various channels into groups, which relies on the use of data. From this point, data largely serves as a foundation for curating an omnichannel marketing strategy. The desired output from this stage would be to create clear buyer personas and gather data across communication channels attributable to these buyer personas. Then, the data should be further analysed to intimately understand how these customer groups engage with different touch points. The aim is to understand how an integrated experience would best serve the different buyer personas. And the last planning stage should focus on the specific changes that can be implemented across the channels to facilitate an integrated and seamless experience for each customer group.

Data largely serves as the foundation for curating an omnichannel marketing strategy

Understandably, the manifestation of an integrated multichannel experience would vary depending on the company – it shouldn’t be a direct copy of a competitor’s. For example, Starbucks created the ‘Starbucks Card’ which doubled as a loyalty card and a wallet. Its value was further shown by its usability for online transactions. Therefore, it is important that changes are informed by actual consumer data or feedback because customers will easily recognise a truly consumer-centric strategy based on whether it elevates their customer experience. Some channels can act as communities that people interact with for research purposes (Linkedin) or for a more relaxed form of interaction (Instagram), while some would simply be visited as they don’t warrant as much participation (email). And with a multichannel and omnichannel approach, it is key that every channel operates in a way whereby they aren’t constructed to fulfill every customer need at every touchpoint. For B2B businesses, a customer shouldn’t be able to conduct the same research or have an identical experience on your Linkedin page as on your Instagram profile.

Presenting multi-source data in unified format

Another key aspect of the omnichannel experience is convenience. Convenience is important because it is about making the online experience more fluid and intuitive, and this is where the sales-focused aspect of omnichannel marketing comes in. With omnichannel marketing, companies should feel able to evolve in how they use their channels or platforms. This can take the form of additional features that target how consumers wish to operate on specific platforms. For example, Mckinsey’s survey shows that around 33 percent of buyers rate 24/7 live chat during the research stage of their journey as a top-three requirement for best-in-class suppliers. Additionally, findings show 70% of customers expect a company’s website to include a self-service application. This may take the form of FAQs on your website or could simply mean having the option to freely browse your company’s product range and access ample information about the product without making direct contact with company personnel.

Omnichannel marketing strategy doesn’t gain merit in its complexity. One common example of an omnichannel approach that many will have experienced is receiving a discount offer or prompt about a product via email after showing interest in the product on an e-commerce website via their own account. It is about businesses being able to meet customer needs more effectively. And as explained earlier, the greater effort and investment involved in a purchasing decision by B2B customers should incentivise B2B businesses to promote convenience and fluidity along their online interactions.

OmniBI

Data analysis serves as an integral part of omnichannel marketing, both in its implementation and to inform any strategic developments. The ability to access and analyse customer data across various channels is best achieved when amassed in a simple and consistent dashboard. OmniBI facilitates exactly this. Contact us to learn more about how OmniBI can help with optimising your omnichannel strategy for your customers.

OmniBI empowers Data-Driven marketers. But, why is being Data-Driven important?

Unsure how OmniBI can help your brand through a data-driven digital strategy?

Whether you know exactly what your business needs to grow, or you’re looking for independent advice and guidance to formulate a comprehensive data-driven digital strategy, let us walk you through OmniBI’s capabilities!

OmniBI makes data simple
We often highlight the benefits a platform like OmniBI can bring to users in making data more easy to understand. It underpins a lot of our users’ data-driven digital marketing strategies. But, why is this important? In this Free Whitepaper, Wonderful (our parent agency) explore how data can be used as a fuel for business growth.

Whether embracing technology to deliver a digital marketing campaign or full digital transformation, data is the lifeblood, the vital ingredient in benchmarking the ‘old’, establishing position amongst peers; setting targets and KPIs; making important business decisions; and measuring future success. 

Download the whitepaper now to uncover how data can be used to fuel your business decision making. 

“Nearly 36% of companies don’t use all the data they possess. 81% of European B2C brands could go extinct because they don’t create relevant content and can’t offer personalized discounts.

The statistics presented in our report are particularly relevant when you look at the make-up of businesses looking to scale this year. Whilst many offer innovative and unique products or services, there is strong competition in almost every case. When the competition is leveraging excellent segmentation and personalisation, this not only puts them at a strong advantage, but the businesses that don’t are at a huge disadvantage, as it fast becomes the norm of customer expectations.

Download the Whitepaper: 

If you’ve already got OmniBI access, you already have a powerful asset for your data-driven journey; if you’re yet to try it, perhaps understanding just how powerful this can be will help launch you in the right direction.

Download The Whitepaper today.

What even is Marketing Analytics, and Why Should You Care?

Unsure how OmniBI can help your brand through a data-driven digital strategy?

Whether you know exactly what your business needs to grow, or you’re looking for independent advice and guidance to formulate a comprehensive data-driven digital strategy, let us walk you through OmniBI’s capabilities!

OmniBI makes data simple
We talk a lot about Data and Analytics, and how OmniBI can help take the complexity and make it simple. But, some businesses struggle to understand the need to be data-driven, even misunderstanding what marketing analytics fundamentally is. In this article, we’ll lift the lid on this topic.
lifting the lid on data analytics

We wrote before about the importance of understanding your digital data, especially in terms of marketing performance, and referenced the need to understand your marketing data as a fundamental pillar of this. However, whilst everyone talks a good game, about how marketing data is key to their business and about being ‘data-driven’, there’s clearly a cavernous education gulf in explaining exactly how businesses can get started with the marketing analytics practices which might actually help marketers identify what is working and what isn’t. More importantly, how data analytics can lead to actionable insights and impactful decision making

This lack of understanding would go a long way to explaining why the CMO Survey from 2019 reported that only 36% of marketers have quantitative tools for demonstrating the impact of marketing spend on company performance. So, almost two thirds of marketers are essentially flying blind, iterating through ill-educated trial and error methods, or going solely on ‘gut instinct’ and perceived precedent. If this resonates with you as a business leader or marketer, it’s important to understand what marketing analytics is before committing to a methodology and tool set to deliver it within your organisation. Let’s dive in.

What is Marketing Analytics?

In a previous article on data-driven decision making, we explained just how much data was potentially at our fingertips, but actually using that data is where marketing analytics comes in.

In essence, “marketing analytics” or “marketing data analytics” is the process by which analysts look to identify meaningful trends and patterns in data to inform marketing decisions. Put more simply, marketing analytics is the path to making data-informed decisions, using them to optimise a business’ marketing spend on activities which actually deliver the highest impact (and, ultimately, ROI).

Marketing analytics is often seen as a sub-section or contributor to business analytics, the process of identifying meaningful patterns in data to inform larger scale business decisions. Many departments employ business analytics, and in today’s digital age, with exabytes of data at our disposal, the case for Marketing leading the charge on this is pretty robust. This is why it should certainly be utilised as a discipline alongside sales analytics, financial analytics, product or service analytics, and customer (CRM) analytics, helping give context to (and drawing context from) these partner disciplines.

The differentiator between just having oodles of “data” and “marketing analytics” is the ability to use the numbers: it’s a vital decision-making tool for answering strategic marketing questions, including:

  • Audience & Segmentation Targeting: Who are we going to target with our marketing activity?
  • Channel Targeting: Which marketing channels should we use to reach these audiences?
  • Messaging: What messaging (copy), and creatives (imagery, video…) should we focus on to ‘sell’ to these segments?
  • Budget: How much should we spend on awareness? How much should a lead cost? What’s our cost of acquisition through each of these channels? How can we spend less to generate more revenue?
  • ROI: What’s our return on investment in each channel? Which activities are driving the best ROI?

If you don’t know the answers to these questions, or can’t find them quickly & easily (and it’s actually a time & resource-sapping cost to the business to do this), then there is a missing piece of your business’ puzzle (one of the many reasons that OmniBI exists!).

“Put bluntly, if you’re not analysing your marketing data (or can’t even find it), you aren’t in a position to say you have a marketing ‘strategy’ at all.”  

James Gray, Head of Digital, Wonderful
Mad men gif of your new head of digital strategy

Why should you care? The business case for marketing analytics:

Hopefully by now we’ve established that marketing analytics is a no brainer – it should be an integral part of your brand’s marketing and operational efforts. But the business case for this can be challenging for marketers to put forward, especially in organisations where the benefits are more obvious at the ‘sharp end’ of marketing operations. That is to say that it’s easier to see how marketing execs benefit from analysing the performance of their individual digital campaigns, but its not so obvious why this is useful to the CEO…

At a very basic level, analytics helps marketers make better decisions, which consequently helps drive more revenue; and if coupled with efficiency and cost savings, can impact ROI and the bottom line for the business.

Analytics is key to digital performance

At a top level this sounds great, in principle. But we’d not be great data analysts if we didn’t back this statement up with some numbers and metrics, would we? A recent study by McKinsey and another by Invesp found that analytics and data-driven businesses are:

  • 23x more likely to succeed in customer acquisition
  • 6x as likely to retain their existing customers
  • 19x as likely to be profitable
  • likely to generate 5-8 times more ROI
A McKinsey Study demonstrates value of being data-driven.

I want to become more data-driven – Show me how.

So, you’ve decided you’re ready to hop aboard the data-driven train to marketing success? Well, you’re not alone, according to Forbes only 13% of marketers state that they are confidently making the most of the marketing data available to them, and around 40% are looking to increase their data-driven marketing budgets – the next step is choosing how you implement this. Being data-driven doesn’t need to be complex. In fact, the beauty of this is that it can (and should) be made as simple as possible to execute, alleviating concerns over resource & time-sapping costs to the business. There’s no point in replacing poor strategy & poor marketing spend efficiencies with poor operational ones, leading to no positive impact on the bottom line.

Bringing all of your multi-source digital data into one place will save you time and effort in becoming analytically driven, which is where OmniBI comes in.

Let OmniBI form the basis of your data-driven marketing.  

Don’t just take our word for it, existing customers rave about how OmniBI is empowering them to become more analytical and data-driven in their marketing. If you’d like to find out how to achieve this, and to explore the impact this could have on you and your business, do not hesitate to get in touch.

Why not book a demo today.

Customer stories demonstrate the true value of data & insight from OmniBI

Unsure how OmniBI can help your brand through a data-driven digital strategy?

Whether you know exactly what your business needs to grow, or you’re looking for independent advice and guidance to formulate a comprehensive data-driven digital strategy, let us walk you through OmniBI’s capabilities!

OmniBI makes data simple
What is OmniBI like to live with? In this article, we share some customer stories from existing users, demonstrating the power of our data and insight tool.

We are very lucky (and grateful) to have received some incredibly positive reviews demonstrating the difference OmniBI is making to a number of businesses from clients who really use the tool “at the sharp end”.

A little history for you: the OmniBI tool was originally borne from a desire for the digital team at Wonderful Creative Agency to demonstrate full transparency and a need to deliver an elegant reporting solution for clients across the plethora of channels used by brands today.

Fast forward a few months (years), and OmniBI has been in use by a large number of agency clients for some time, and has really started to enable these clients to not only visualise & aggregate their data, but to pivot more dynamically and optimise their marketing performance.  

From the Public to Private Sector, and beyond…

We’ve worked with Cantium Business Solutions for some time as an agency partner, and have gone on their transformation journey with them, from brand inception to full public-to-private sector evolution. It’s excellent that we can now take this in-depth understanding and apply it to crafting a valuable set of data charts and metrics, aligned to KPIs and business goals through OmniBI.

“We implemented OmniBI into the marketing team around 6 months ago, and the simplicity with which it presents our key metrics has been both time-saving and eye-opening. We no longer have to log in to Analytics, Ads platforms, Email systems etc and apply endless filters to see the results we need, we simply log in and it’s all there in one place. We’ve been particularly impressed by the ability to create specific tailored charts which track and measure performance across our business’ core product areas, which has given us real transparency and demonstrated where we need to be focussing our efforts digitally. We can now spot trends and make changes to our activity quicker and more efficiently, and the added insight from the OmniBI Team, coupled with the ability to add bespoke new charts and views really allows us to drill into what matters and make better strategic decisions.” 

Peter Fennell, Head of Marketing, Cantium Business Solutions

This is a fantastic example of a client truly embracing the power of OmniBI. With a wide variety of channels and systems/platforms operating across different departments within the business, data is plentiful, but it is also complex. The simplicity with which OmniBI presents all of this data is key.

Whilst Clarendon build real homes, OmniBI creates a home for their data:

A successful home development brand, Clarendon Homes design and build stunning bespoke properties in the South East of England, and partnered with Wonderful to enhance their digital marketing. Adding a number of new channels to their marketing mix, embracing the likes of Google Ads, Facebook Ads and more, coupled with operating different marketing calendars based on each of their developments’ progress has increased their need to see results and analyse campaign performance.

Alecia Crayford is Marketing Manager for the development firm, and explains how they use OmniBI very succinctly:

“We haven’t previously had great visibility of our online performance, and as a busy marketing team, we often struggle to find the time to log in to all the relevant platforms to get the big picture. The OmniBI tool has given us a very quick and clear view on what’s happening with our campaigns and our website performance in one place, saving us time and enabling us to make sure we’re spending our budget wisely. Operating & marketing multiple new housing developments at the same time, it’s great that we can split our charts by development level so we can see which are more popular and which need more effort in promotion and marketing. We have also branched out more into social and search PPC in the past six months, and can really see which channels are driving the most traffic and leads, endorsing our digital strategy. We can also align our sales funnel to the types of conversions we see in the charts, from people ‘window shopping’ to brochure downloads and tour bookings. OmniBI really does give us an excellent steer on how we can optimise our marketing efforts.”

Alicia Crayford, Marketing Manager, Clarendon Homes

With a very defined sales process and customer journey, it’s even more important to align stages of the marketing campaigns to those decision making points, something which OmniBI facilitates efficiently through an array of funnel visualisations and filtering.

Explaining digital marketing succinctly to all stakeholders is a challenge:

We often explain the benefits of OmniBI differently to CEOs and MDs than we do to Marketing Executives and Campaign Managers. Why? Well, put simply, different stakeholders need to understand different things. Whilst the granularity of daily traffic charts and campaign ad group performance may excite those working in more practical, hands-on roles, the same can’t be said of C-suite managers who really care about the big numbers (how are all these data points collectively pulling us towards our revenue and profitability targets?). This is where OmniBI’s ability to present the right data in a meaningful way proves beneficial.

Rob Gibbs is Marketing Manager for The Retail Mutual, a UK provider of business, home and landlord cover for independent retailers and service providers. As a ‘mutual’, they have increased responsibility to demonstrate their financial performance, including across marketing activity:

Omni has saved me and my team a lot of time when it comes to reporting. The visual elements really help when it comes to explaining website performance with stakeholders. Omni takes some of the key elements and measurable metrics from Google Analytics and other channels, and compiles them into an easy to navigate platform, making it simple for us to keep up to date with our digital marketing performance.

Rob Gibbs, Marketing Manager, The Retail Mutual (RMML)

This time-saving element is not to be overlooked – producing different reports, with data from different channels, for different teams/audiences can be time-consuming and labour intensive. OmniBI’s ability to collate this data, and the new one-click reporting export functionality we rolled out as part of the latest OmniBI update, makes this wonderfully simple.

“It’s impossible to be a digital business without being a data-driven enterprise.”

Endorsements from existing users fill the OmniBI Team with confidence that we are developing the platform in the right direction and, ultimately, having a positive impact on businesses as they look to grow. The underlying tone within the industry reinforces these real world case studies. Mike Rollings, Research Vice President at Gartner Inc. said in October 2019: “It’s impossible to be a digital business without being a data-driven enterprise.”

We couldn’t agree more (and it appears our users agree too).

If you’d like to find out how you can enjoy experiences like other users on the platform by integrating OmniBI into your business, do not hesitate to get in touch.

Why not book a demo today?

How data enables marketers to do more of what works and less of what doesn’t

Unsure how OmniBI can help your brand through a data-driven digital strategy?

Whether you know exactly what your business needs to grow, or you’re looking for independent advice and guidance to formulate a comprehensive data-driven digital strategy, let us walk you through OmniBI’s capabilities!

OmniBI makes data simple
In this article, we explore how your marketing data can be used to drive your strategic decision making, empowering you to make better choices and deliver better results.
Analyst looking at OmniBI data

From recent Marketing graduates to established Marketing Directors and CMOs, many will resonate with the words of John Wanamaker (a very successful US merchant and political figure from the 1800s, considered by some to be a “pioneer in marketing”) where he famously lamented: 

“Half the money I spend on advertising is wasted; the trouble is I don’t know which half.” 

John Wanamaker

A pretty damning quote for the marketing and advertising industry. In fact, many marketing leaders and industry commentators claim that it’s even worse than half, and that the majority of advertising/marketing budgets are wasted

But in today’s data-driven world, this just does not have to be (and should not be) the case. Reports claim that by 2025 its estimated 463 exabytes of data will be created daily! A proportion of which will be data from your digital footprint, most of which will go undiscovered, unread and under utilised. 

From a recent LinkedIn survey of digital leaders and marketers undertaken by the OmniBI Team, a resounding number of respondents demonstrated the sheer array of channels being utilised today: 

Source: LinkedIn Survey by OmniBI

The majority, 51%, use between four and six digital channels, with almost a quarter, 24%, using over ten channels. Most interestingly, this alludes to the fact that the diversity of channels in use today requires marketers to be multi-faceted and highly diligent in their approach.

We asked marketers to count individual ad platforms, social networks, websites et al as one channel. A small number of survey respondents additionally commented on the poll, happily listing out examples of the specific channels they utilise: “Website, Google PPC, Bing PPC, Facebook, Instagram, Twitter, Pinterest, Affiliate, Email, SMS, Digital PR, Subscribers, App, Print Flyers, Referral, Influencers…” – quite the myriad and, more importantly, quite a variety of data sources to leverage.

One respondent explained they have a team of 5 managing their 10+ channels

The challenge here lies in being able to use all of this data (well, the meaningful bits!) to make actionable decisions. Statistics show that 47% of marketers suffer from “siloed and difficult to access data”. This multi-platform data takes time to source, analyse, dissect and aggregate (which is where OmniBI comes in, of course). Plus, different marketers, in different teams, using different platforms end up pulling in different directions toward the one same goal.

This is where adopting a universal approach to this multi-platform data becomes the pivotal element, enabling change within a business. Without data analytics, Wanamaker’s statement comes true – with data analytics, marketers have an unfathomable advantage over marketers of the past, and those who chose to embrace a data-driven strategy will, ultimately, win out. Data enables teams to analyse the past and work out which precise campaign(s), message(s) or process(es) delivered the best results for the desired goal. In fact, businesses using data-driven strategy drive up to 8x more ROI.

Data isn’t all things to all people.

A successful data-driven strategy relies on teams choosing the right metrics against which to measure success. This certainly doesn’t mean the same thing to everyone in the team – the ‘metrics which matter’ vary vastly at different levels of the marketing operation and of the business as a whole.

Marketing Executives, tasked with the execution, delivery & optimisation of individual campaigns may look at metrics like ‘engagement’ and ‘sentiment’ to steer their decision making. Let’s take a social-first campaign execution – it’s valuable for those managing these campaigns to dig down at campaign, post and asset level to measure the success of individual campaigns – to identify what worked and what didn’t. This is the basis of good optimisation decision making – optimisation is, by it’s very nature, a ‘tweak and refine’ process.

C-Suite Leaders and Marketing Execs don’t need to see the same data.

However, CMO’s CEO’s and others at C-suite level are less interested in finding out which image on a Facebook carousel generated the most dwell time and/or clicks. This level of sentiment and engagement means relatively little to them in of itself. At this level, it’s the larger numbers which matter (and more often than not this boils down to revenue generated & ROI). Joining these dots is key: demonstrating that the sum of the small incremental campaign adjustments and enhancements combine to deliver the ‘big’ numbers.

To a degree, data-driven marketing in the trenches is about creating successful campaigns; but at C-Suite level, it’s more about demonstrating that success within the company.

Charts showing campaign and revenue numbers
Aligning campaign performance with sales revenue to join the digital dots.

It’s clear that no matter your role in the organisation, your marketing data should be used to drive your strategic decision making, empowering you to do more of what works and less of what doesn’t, delivering better results. Demonstrating this is the challenge, which is where reporting is a key differentiator.

For marketers, “a clear reporting strategy is the difference between being successful, and your boss knowing that you are.” and to win at this game, reporting the right information to the right people, in a wonderfully simple way is paramount.

Data-driven marketing isn’t the future, it’s here already.

Some say that “data-driven decision making is the future of marketing”. We believe that it’s the “present”, it is here now. We’ve demonstrated the importance of data in enabling brands like yours to:

  • Engage your audiences (and do so more personally).
  • Create more relevant & better targeted content.
  • Identify issues & negative trends and re-steer the ship.
  • Do more of what works (leverage success, deliver better ROI).
  • Do less of what doesn’t (stop wasting money, learn from mistakes).

Isn’t it about time we all became Data Scientists (to a degree)?

Going back to Wanamaker’s fable, we think it is possible to know which half of your marketing is performing. In fact, it’s actually possible to determine how much of the budget is working, how much isn’t performing, where it is performing, why it is performing, who it’s performing for and what actions can be taken to optimise this performance, whilst demonstrating the impact on the ‘big numbers’ too. Across all your channels. All in one place.  

Pretty cool huh? 

If you’d like to find out how to achieve this, and to explore what this could mean for you and your business, do not hesitate to get in touch, or book a demo today.

How OmniBI can help reduce wastage & increase sales

Unsure how OmniBI can help your brand through a data-driven digital strategy?

Whether you know exactly what your business needs to grow, or you’re looking for independent advice and guidance to formulate a comprehensive data-driven digital strategy, let us walk you through OmniBI’s capabilities!

OmniBI makes data simple
We recently on-boarded an exciting new client to the OmniBI platform, and it became rapidly apparent that budget was being wasted through ill-conceived metrics and reporting, stifling sales opportunities.

When we onboard new clients to the OmniBI platform, there are a number of very common metrics we always tend to be asked for – and when building a client’s dashboard, we pretty much get these charts created ‘straight out of the box’. But, as part of the onboarding process, we hold a Discovery meeting, where we truly explore the activities, channels and challenges being faced by the business, prior to investigating and creating a dashboard which cuts through the clutter and unearths the metrics which matter. The value of this process became clearly apparent when we on-boarded one of our most recent new users.

“But we got loads of traffic from that campaign, it must have been successful...” 

The Wonderful Agency Team, our experts behind the scenes of OmniBI, have written an excellent article explaining the metrics businesses should really consider to measure success, and the importance of not falling into the trap of focussing on vanity metrics. An obvious digital metric most users track is Traffic. A seemingly valid assumption in this scenario is that the more people you get to your website, the better.

Of course, by and large and in a lot of cases this can be a consideration, but here-in lies an origin of the old adage: Quality over Quantity. The truth is, it should really be the quality of a site’s traffic which is measured (digging into a range of other metrics to discern good, bad and ugly).

So, onto the recent example. The first thing that raised suspicions was traffic charts presenting some clear and distinct increases in traffic during certain months. Often, this can be caused by seasonal trends, or real curveballs like Covid19 (which really affected trends for some users), but more often than not, spikes in traffic are caused by an activity/action specifically geared toward this result.

After cross-referencing this against the page-views and source/medium/channel charts on this client’s dashboard, it became very apparent where these traffic increases had come from.

OmniBI Charts showing Traffic and Sources

Ok, so it’s pretty obvious (and you don’t need to be a data scientist) to see that Programmatic/Paid advertising contributed to the spike between March and June 2020. So, it’s time for the team to celebrate, right? Well, before getting the champagne and considering the campaign a success, it is important to look at the metrics that matter to this business. Now, if this was a new brand, in a new market or territory, just looking to get eyeballs on the product and with the sole aim of driving traffic, one could consider this a successful campaign (depending on the budget/CPMs/CTRs etc, but we won’t get into that now).

However, this brand currently holds the second biggest share of market in their niche (only a small % away from claiming top spot), and whilst the traffic volumes from this source contributed to around 50-75% of their traffic in this period and tens of thousands of sessions, this was not reflected in the metric that mattered: purchases.

Whilst the business saw some improved conversion during these periods, the contribution to conversion directly attributable to the programmatic campaigns was not proportional. Further investigation into the sources of conversion using the Conversions vs Source/Medium chart demonstrated this clearly.

Image

The campaign certainly drove huge increases in vanity metrics (such as impressions) and clicks/traffic to the site, but the conversion rate was being dragged down as the quality of the traffic was just not good enough. It just wasn’t the right fit for them if conversion rate was their KPI metric, or the progress would need to be monitored over a much longer term to see the actual effect (heightened brand awareness, trust/authority built, increase in buying intent over time, returning usage, conversion rate improvements in the long term, and so forth).

Data is only as valuable as the insight that can be drawn from it…

In isolation, this data may not prove very valuable. In fact, if the business had just gone on ‘traffic’ as a metric, they may have concluded that their programmatic campaign was working very well, and invested even more heavily into this as a channel. However, after aligning the performance charts to their actual goals, it becomes very apparent that there may be better ways of spending this budget on other, higher-converting channels such as their Organic activity and Google CPC campaigns where the conversion rate (a ratio of traffic/sessions to conversion actions) was substantially better.

Delivering better ROI requires both the inputs and outputs to be improved, cost and results. This is where data-driven strategic thinking can be so powerful, showing a business where they can make cost savings whilst also improving their conversion rate: lower costs, better results.

Unlike many data tools, OmniBI is powered by two-way communication with the pro-active digital experts at Wonderful. So trends like we’ve seen in this example undergo scrutiny, the team investigate the causes and effects and, more importantly, offer strategic recommendations with actions which can be taken to change the course of a negative trend (or maximise the impact of a positive one). Notifications to all user’s dashboards are received as part of an emailed daily digest, so when comments are added to charts and insight delivered in response, you’ll know right away and can implement the changes needed to bring results.

OmniBI makes this so simple, there’s not much more to say in this article. Add comments, receive actionable insights. Make better decisions, and deliver better marketing performance driven by data.

Experience it for yourself: 

If you’ve already got OmniBI access, you already have this functionality and can use it right away! If not, but it’s something you and your team may find valuable, the team behind OmniBI would love to show you a demonstration of the tool, so please book a demo today.